


Hello,
Just when you think finance is boring, it surprises us. Lately, it seems that everyone is rebuilding finance in ways few would have anticipated. Even those coming from the entertainment and media industries.
Take Jimmy Donaldson, also known as “MrBeast” on YouTube and the owner of a snack empire, who acquired a banking app to make financial literacy and money management accessible among teens and young adults. Why? Perhaps nothing comes closer to monetising a 466-million subscriber base with a financial product.
This summer, CME Group, the world’s largest derivatives marketplace, is launching Single Stock futures that will allow users trade futures on more than 50 top U.S. single stocks, including Alphabet, NVIDIA, Tesla, and Meta.
Such reinventions show us what’s changing in how people want to engage with finance. Few things demonstrate this better than the explosion of perpetual markets in the past couple of years.
Perpetual futures, or perps, are a type of financial derivative contract that allows market participants to speculate on an asset’s price without an expiration date. Perps also let people express opinions on assets quickly and cheaply. They are more fascinating than traditional markets because they offer instant access and leverage. Unlike traditional markets, these require no brokerage onboarding, no jurisdictional paperwork, and don’t follow “conventional” market hours.
Moreover, on-chain perp markets can make any asset, traditional or crypto, available for trading in a permissionless and highly leveraged manner. This makes speculation fun. Especially when humans can’t resist betting on the trajectory of an asset during choppy times outside conventional market hours. This enables risk to be priced in real time.
Consider what happened a couple of weeks ago. When both the traditional and crypto markets were in meltdown, traders flocked to Hyperliquid, driving perpetual gold and silver trading into a frenzy. On January 31, Hyperliquid alone captured 2% of the world’s daily silver market trading volume on its Silver perp market that was launched barely a month ago.
That explains why perp volume dashboards are increasingly dominating crypto communities and forums. Volume is an absolute number. It appears big, refreshes every few minutes and makes for great leaderboards. But then it misses a key nuance. Volume can reflect motion that could lack meaning. A market can trade a lot because it’s deep. However, it can also trade due to rewards and incentives that encourage greater activity. This activity is often recursive and lacks meaning.
This week, I delved deeper into additional metrics for perp trading markets, which, when paired with volume, add greater nuance and tell different stories than volume alone.
Let’s get started
The user-friendly interface of perpetual markets has made them a low-barrier, default interface for expressing opinions across various markets and global assets.
The wide range of options to trade derivatives on both traditional and crypto assets on a single platform with high leverage has led perps to surpass spot volume on decentralised exchanges. From 44% in February 2025, perp volume dominance has surged to ~75% today relative to spot volume.
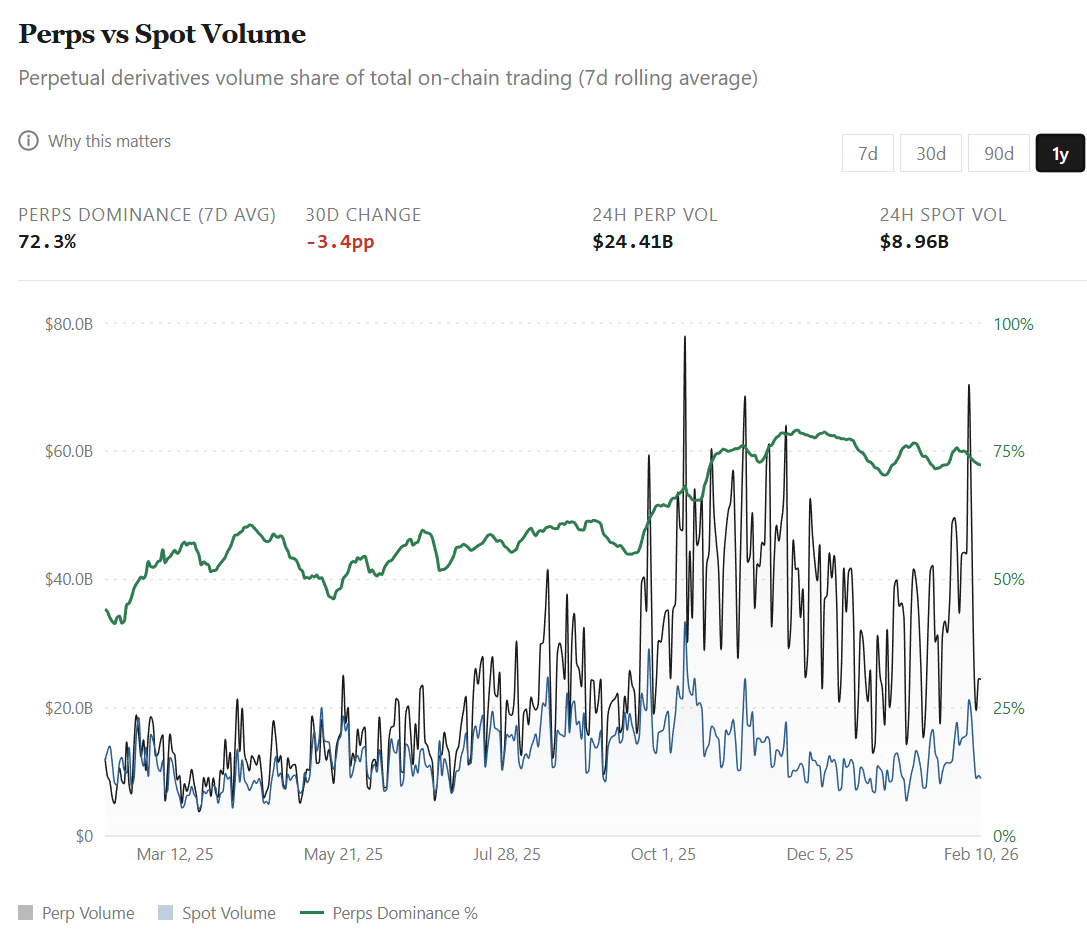
This increased perp activity has been even more pronounced in the past few months.
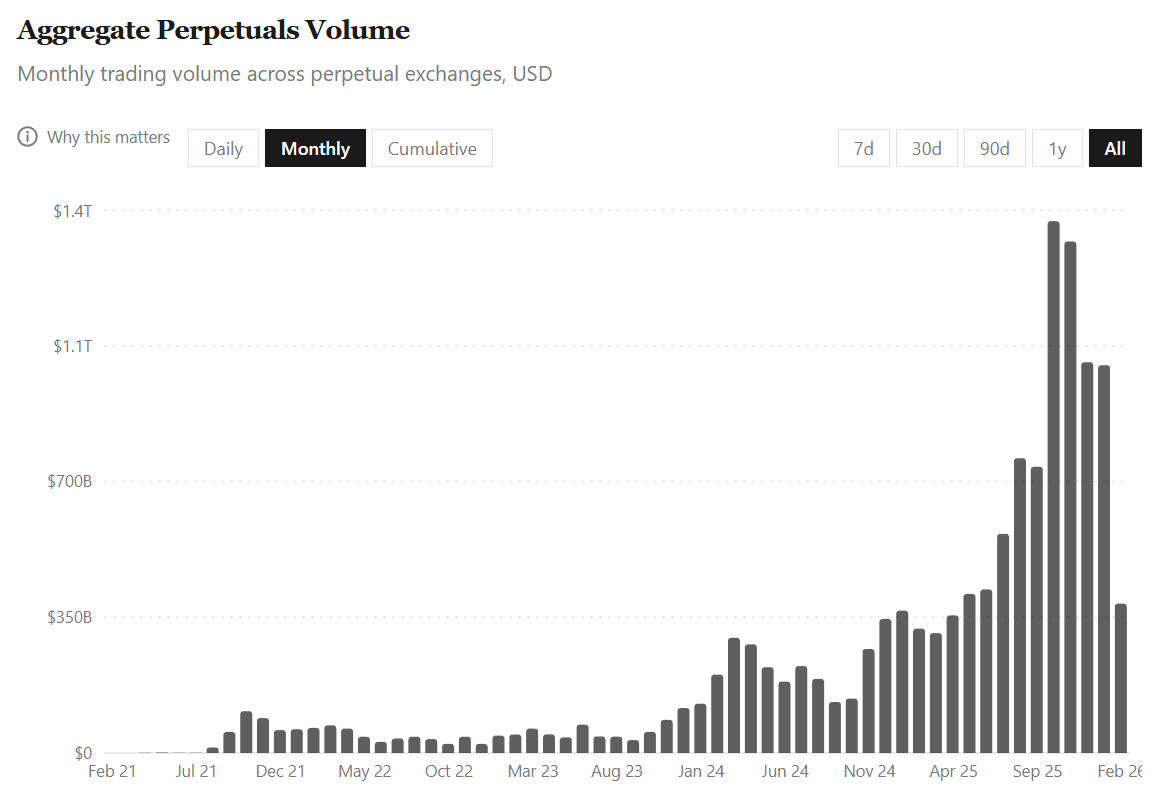
The cumulative perpetual trading volume across all platforms for the four years ending July 31, 2025, totalled $6.91 trillion. In just the last six months, that volume has doubled to $14 trillion.
All this growth has occurred despite the crypto market cap slipping almost 40% between August 1, 2025, and February 9, 2026.
The activity indicates that traders increasingly prefer derivatives trading, hedging, and short-term positioning, especially when the spot market becomes choppy and bearish.
But there’s a catch here. With so much activity, it’s easy to misinterpret the volume metric. Especially because perp trading isn’t merely buying and selling an asset after holding it for long periods. It also includes repeatedly resizing a bet with leverage and tighter timeframes.
So, when the market’s turnover accelerates quickly, an inevitable question crops up in my mind: Is all the record-high volume reflecting more capital inflow, or is it because the same capital is cycling faster?
This is where looking at Open Interest (OI) helps. While volume reflects capital flow, OI measures outstanding exposure. On perp exchanges, OI is the total dollar value of active and unsettled long and short contracts held by traders.
If perp trading is adopted by mass markets, one would expect not only greater capital flows but also a proportionally larger outstanding exposure.
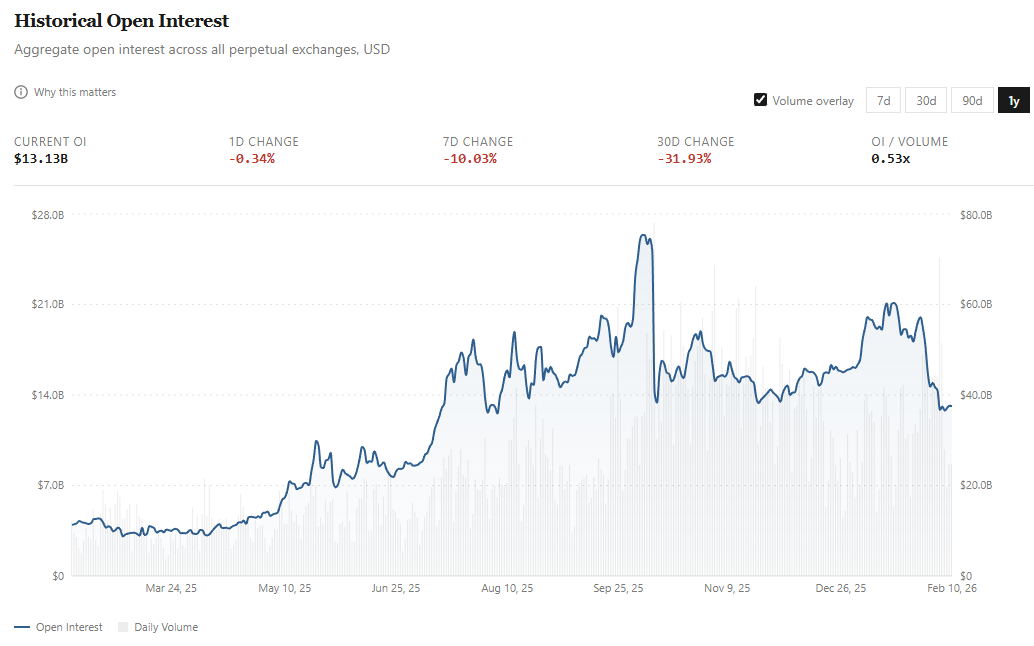
From averaging around $4 billion in February last year, OI has more than tripled to roughly $13 billion. In fact, it averaged ~$18 billion throughout January before declining by ~30% in the first week of February.
Although perp volume has doubled over the last five months, OI rose by roughly 50%, from $13 billion to approximately $18 billion, before falling back to $13 billion.
To understand this better, I look at how capital efficiency, OI as a percentage of Daily Volume, has moved over the past year.
The OI/Volume ratio has jumped 50%, from 0.33x last year to 0.49x today. But that progress hasn’t been smooth. The ratio experienced multiple peaks and troughs during its 50-basis-point growth.
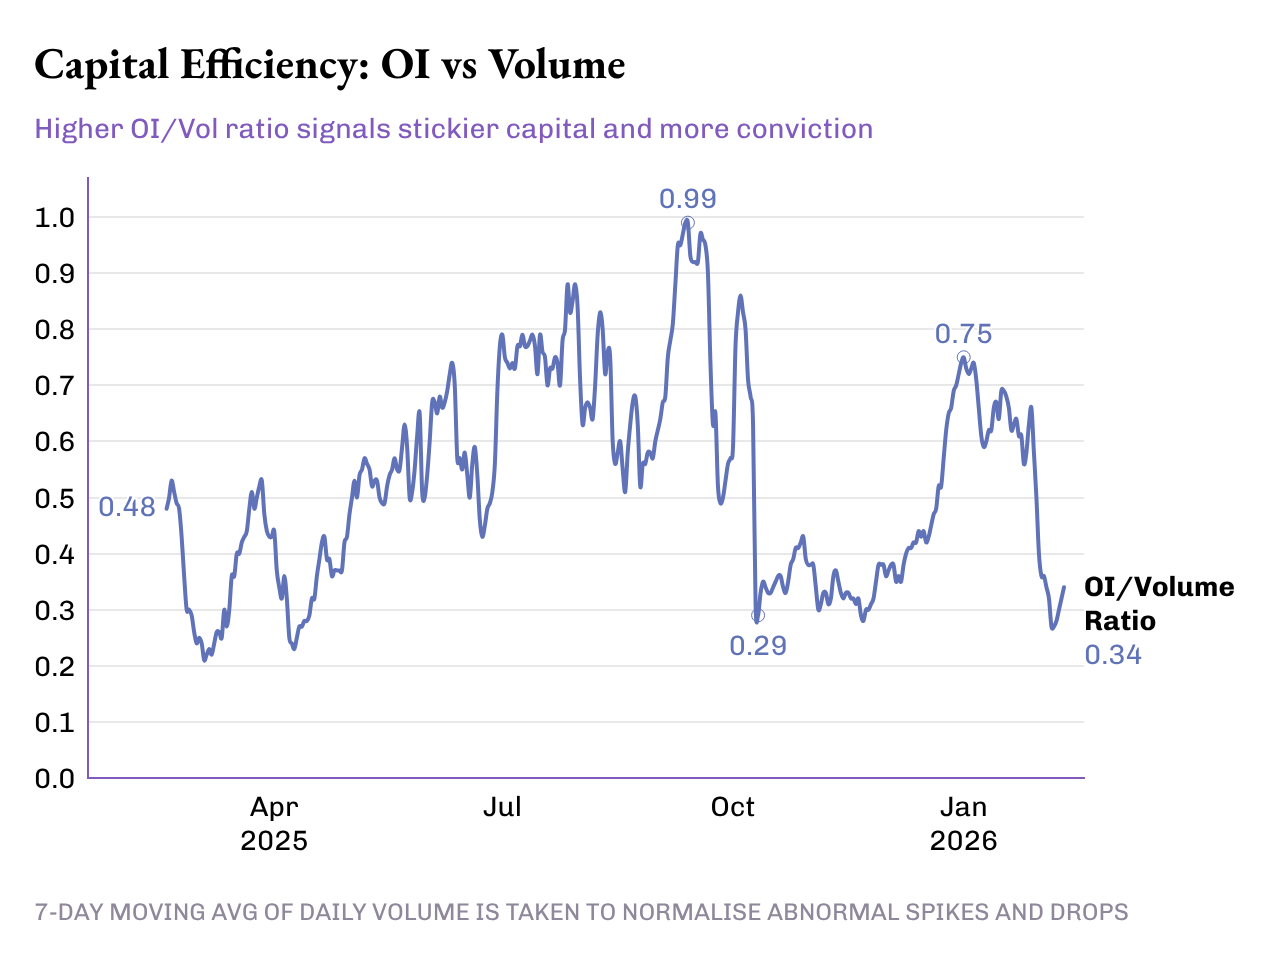
The first phase was a quiet one, between February and May 2025. The OI/Volume ratio averaged ~0.46x, with average OI around $4.8 billion and average daily volume around $11.5 billion.
Then the ratio jumped and averaged about 0.72x between June and mid-October, the second phase. In this period, average OI rose to $14.8 billion, and daily volume averaged $23 billion. This signalled not only record-high trading volumes but also increased risk exposure and greater capital commitments to these derivatives.
In the third phase, the market reversed. The start of this phase coincided with the mass liquidation on October 10 that wiped out over $19 billion in leveraged positions within 24 hours.
From mid-October to late December, the OI/Volume ratio dropped to ~0.38x, driven mainly by a rise in volume while open interest stayed mostly stagnant. October, November, and December recorded the three highest monthly trading volumes in 2025, averaging over $1.2 trillion.
During the same period, OI averaged ~$15 billion, marginally less than the average in the preceding three months.
This is where I wish to add more nuance to the analysis of the perp market at the protocol level. This helps us understand how efficient perp exchanges are at converting trading activity into sticky capital and revenue.
As of February 10, here’s how the top five perp exchanges by 24h volume stack up:
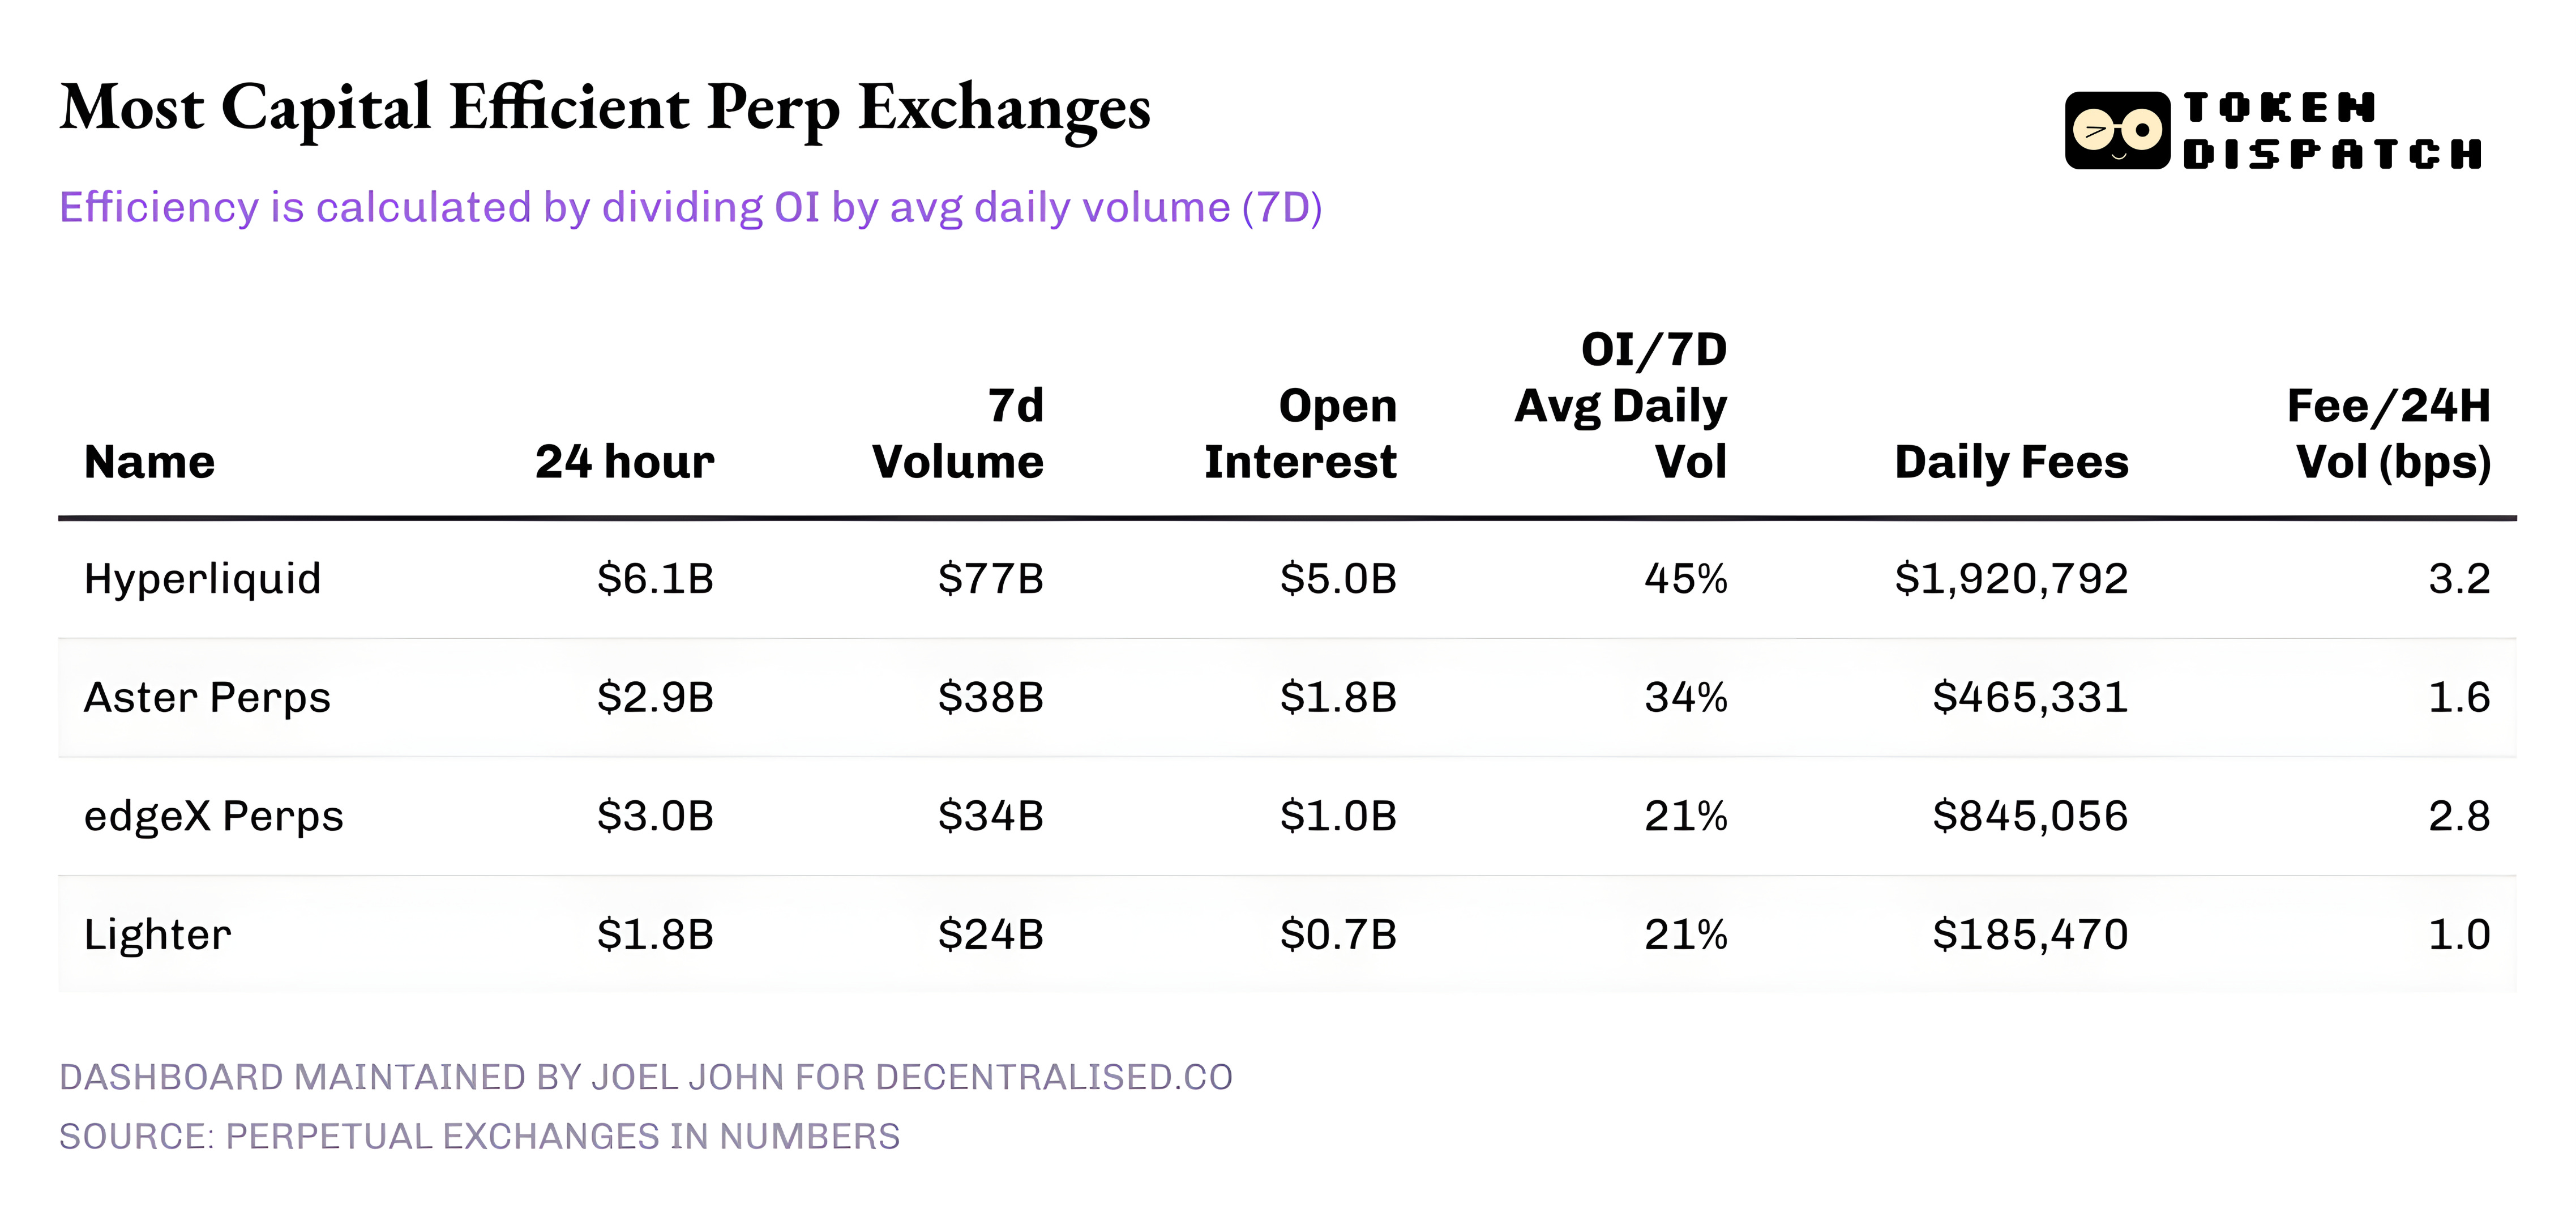
With an OI to average daily volume (across 7 days) proportion of over 45%, Hyperliquid converts a large share of its volume into persistent positions. It shows that $4.5 out of every $10 traded on the platform is committed to active positions. This matters because a higher OI rate yields tighter spreads, deeper liquidity and the confidence to scale size without slippage.
Hyperliquid’s fee income reinforces this story. At approximately 3.2 basis points of take rate, Hyperliquid is converting the largest share of 24-hour volume into fee income.
Aster, currently ranked second, also has a decent OI/Volume capital efficiency of 34%, despite having almost half the volume of Hyperliquid. What stands out, though, is monetisation. With a lower take rate of ~1.6 bps, Aster is prioritising capital retention on its platform over fee maximisation.
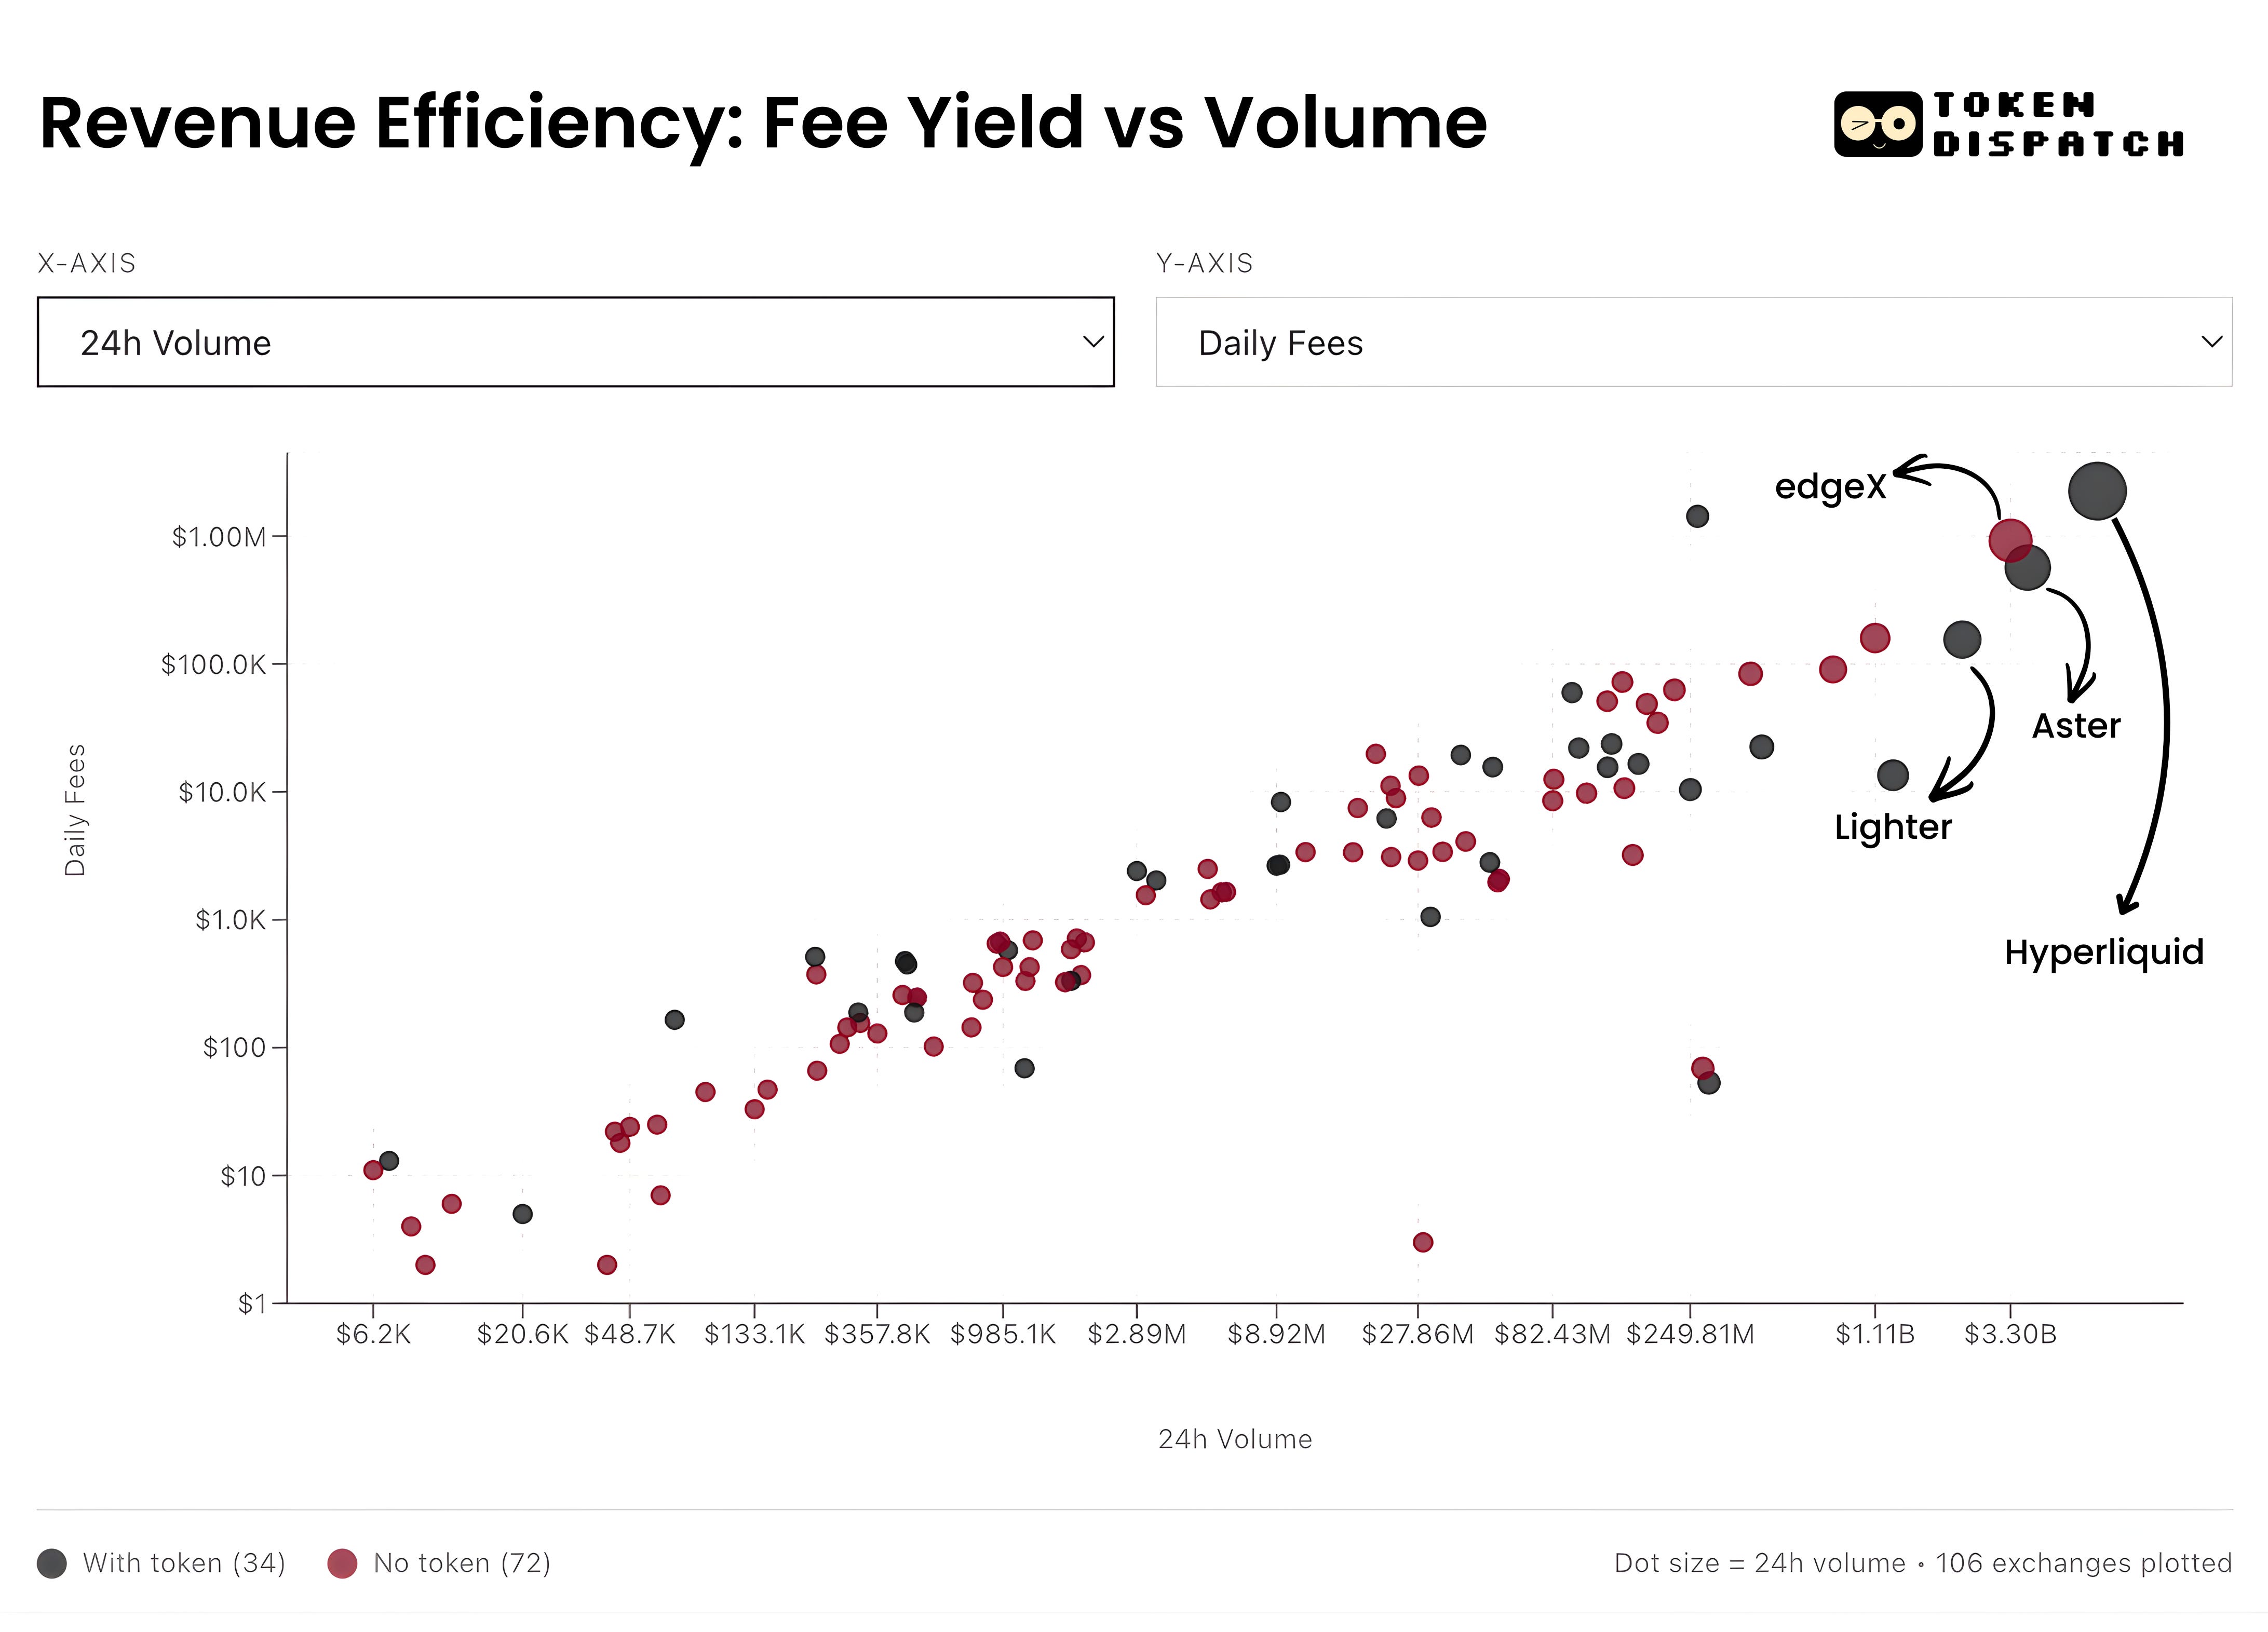
Meanwhile, edgeX and Lighter perform similarly on the capital-efficiency ladder, with 21% OI/Vol. However, edgeX is comparable to Hyperliquid in fee monetisation, at 2.8 bps.
What stands out is that the perp market today is less of a plain-vanilla growth story and requires a nuanced interpretation of multiple metrics. At the aggregate level, volume has exploded. In six months, cumulative perp volume grew more than it did in the four years before. But the picture becomes clearer when OI and volume are read together.
Yet, what’s a clearer win is when the OI/Vol ratio grows. It is a direct signal of patient capital willing to trust and bet on various products and markets emerging on perpetual trading exchanges.
What is more interesting to monitor is how individual players progress from here and what they choose to optimise for. Over time, exchanges that optimise for conviction and monetise it sustainably will matter far more than those that top the volume charts by relying on rewards and incentives.
That’s it for this week’s quantitative analysis. I will be back with the next one.
Until then, stay curious,
Prathik

Token Dispatch is a daily crypto newsletter handpicked and crafted with love by human bots. If you want to reach out to 200,000+ subscriber community of the Token Dispatch, you can explore the partnership opportunities with us 🙌
📩 Fill out this form to submit your details and book a meeting with us directly.
Disclaimer: This newsletter contains analysis and opinions of the author. Content is for informational purposes only, not financial advice. Trading crypto involves substantial risk - your capital is at risk. Do your own research.