


Hello
November has historically been a mixed bag for crypto. This year, too, the month stands out in stark contrast to the last two.
BTC and ETH closed the month 17% and 22% in the red, as against 37% and 47% gains in November 2024, respectively. While that could be attributed to the euphoria surrounding Donald Trump’s re-election as POTUS, they were up 9% and 13% in November 2023.
This year’s crypto rout in November was driven by a broader market meltdown over the past two months, fueled by tariff wars and uncertainty about macroeconomic conditions.
The contrast is evident even across the exchange-traded fund (ETF) dashboards for 2025 and 2024.
In November 2024, Bitcoin spot ETFs attracted about $6.5 billion in net inflows, while Ethereum ETFs added $1 billion. ETF issuers were holding bitcoin worth over $105 billion and ETH wrappers worth $11 billion. Twelve months later, BTC ETFs saw about $3.5 billion in net outflows in November 2025. Ethereum wrappers shed about $1.4 billion. Roughly a $12-billion negative swing in monthly demand for the two flagship wrappers.
On paper, ETF issuers manage more assets today than a year ago. Cumulative net inflows are positive, total assets are up, at least marginally. But the ETF flows flipping from green to red in the last few months tell us how much issuers miss out on fee collections.
In this week’s quantitative analysis, I will examine how the three largest sponsors of BTC and ETH spot ETFs performed when demand for and prices of their underlying assets declined.
Now, onto the story,
Prathik

Raiku, Where Every Transaction Actually Lands
On Solana, speed’s great, but reliability? That’s the real missing piece. Raiku fixes that.
Guaranteed block inclusion and low-latency execution under load
Built for institutions, market-makers, and high-performance apps
Recently raised $13.5 million led by Pantera Capital to scale its architecture

If you’re building on Solana and want your actions to mean something, not just a race for gas, Raiku sets the standard.
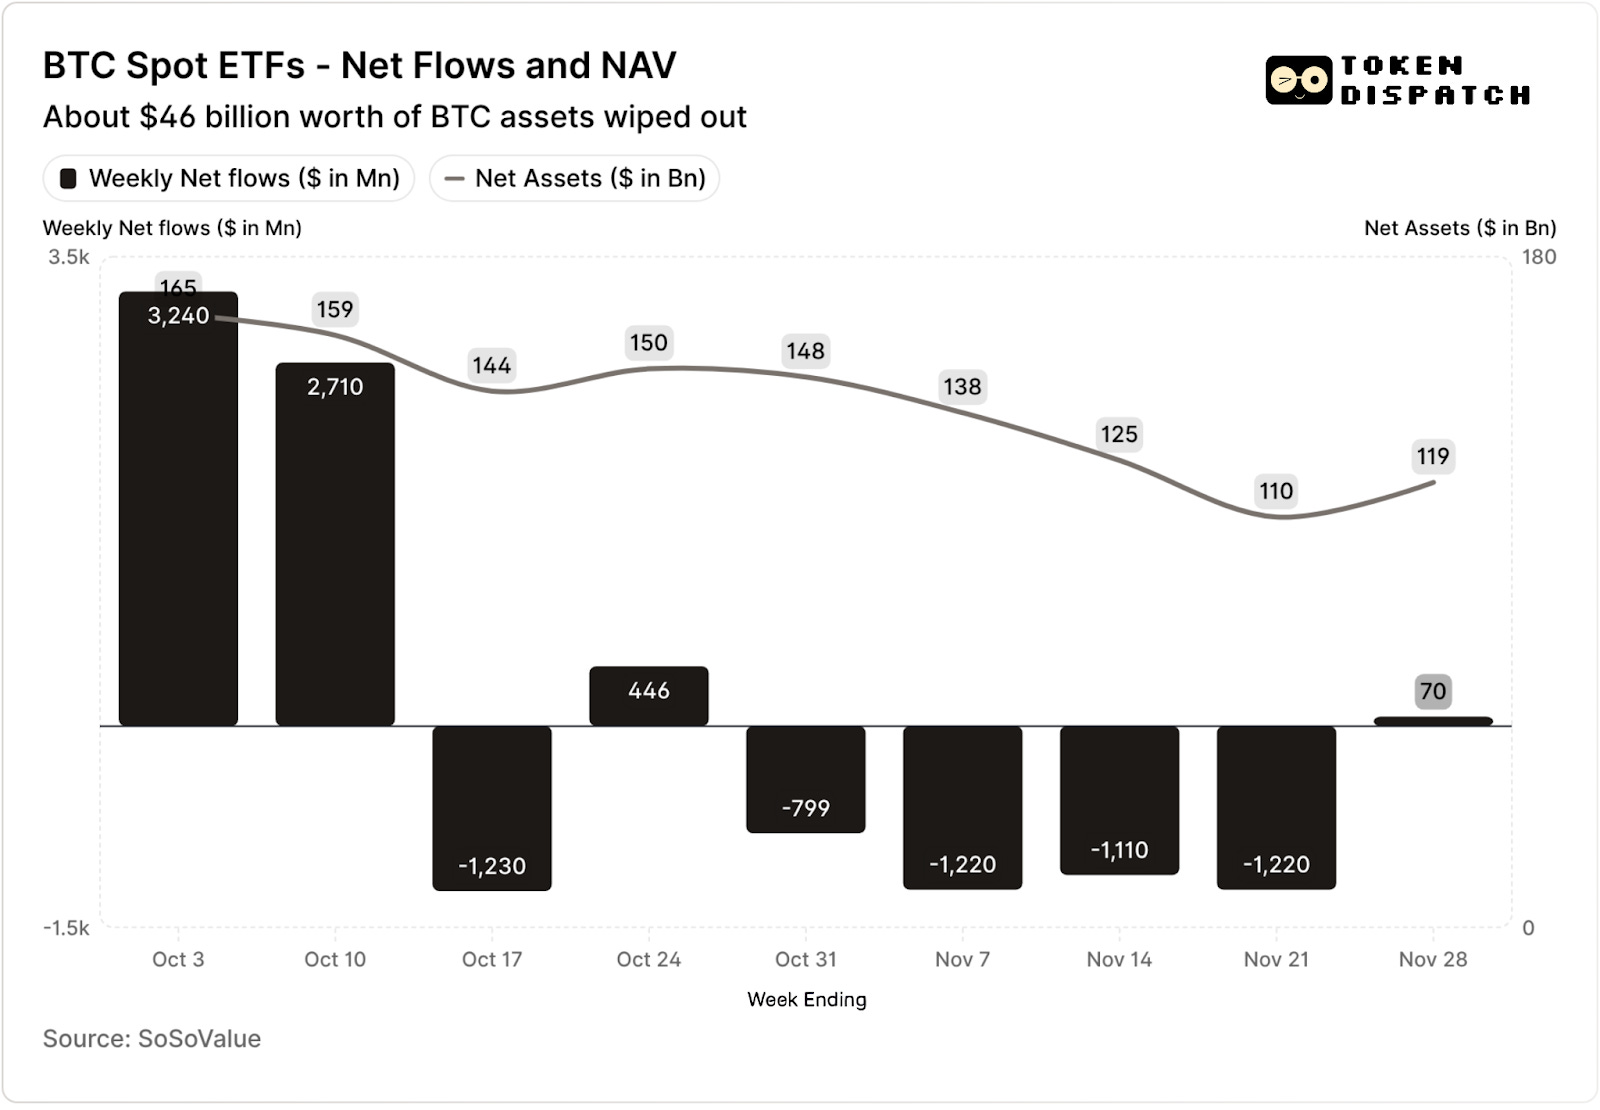
Bitcoin spot ETFs attracted $3.2 billion and $2.7 billion in the first two weeks of October — the highest and 5th highest weekly flows in 2025.
Until then, BTC ETFs seemed on track to finish second half of 2025 without ever seeing back-to-back outflow weeks.
Then came the worst crypto liquidation event ever recorded. The crypto markets are still reeling from the $19-billion wipeout.
ETH ETFs also pulled in $1.8 billion in net inflows over the same period.
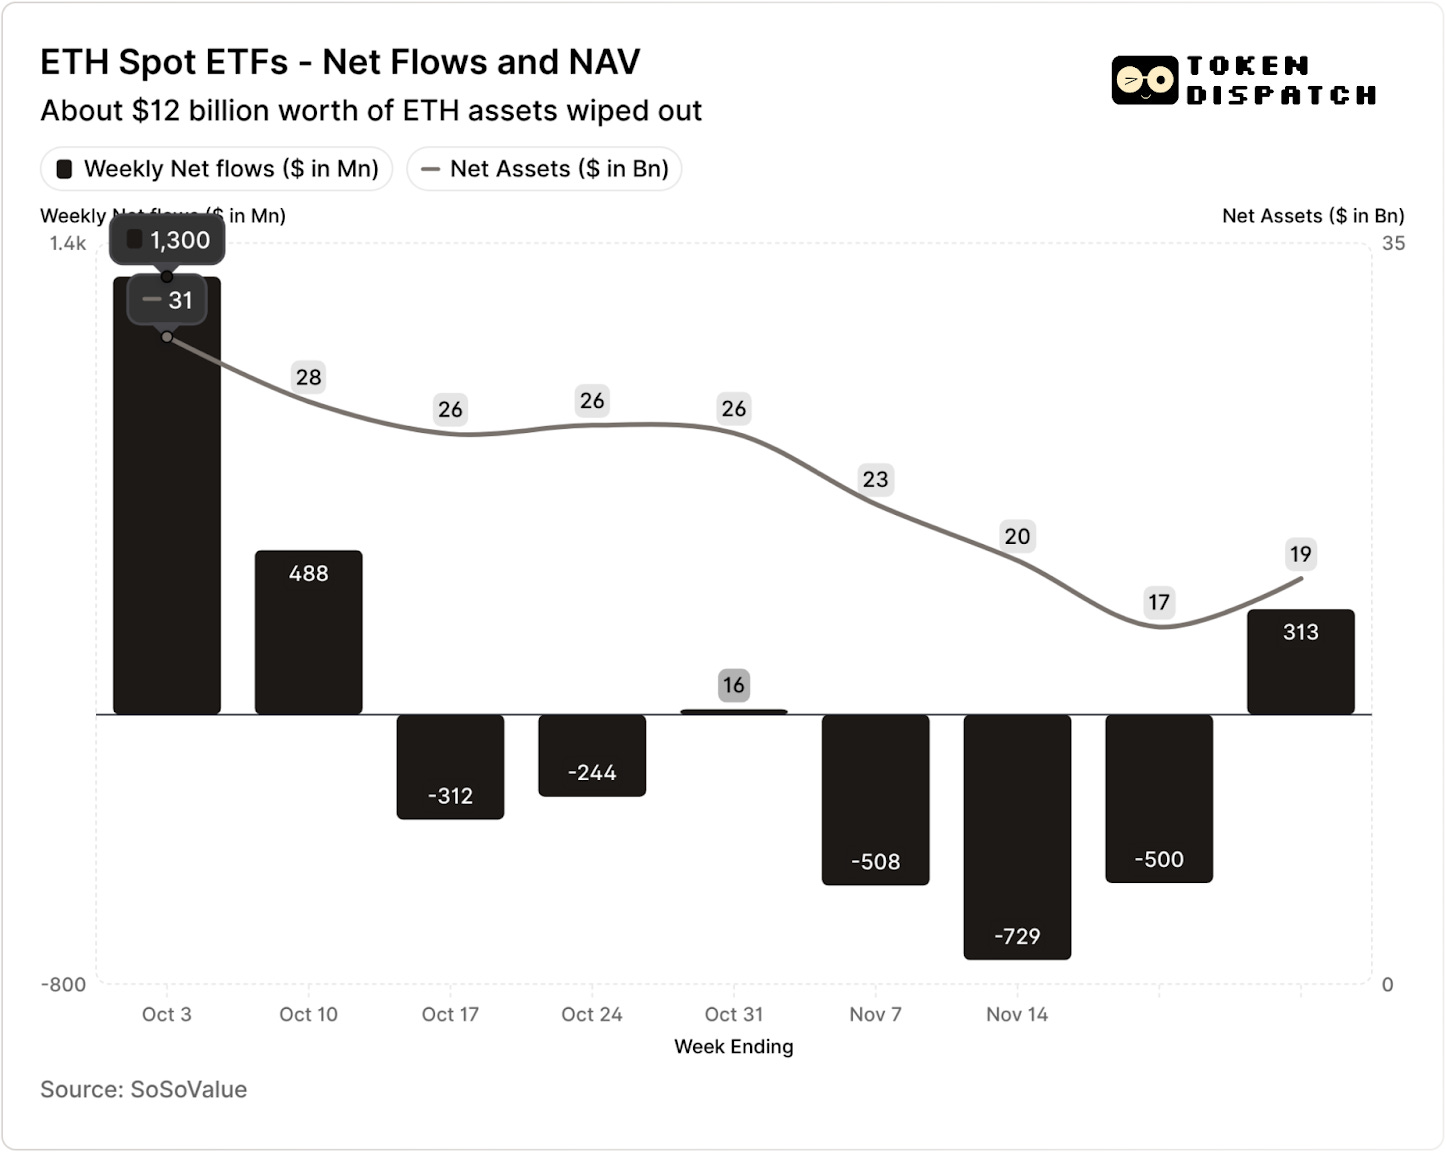
Both BTC and ETH ETFs have seen outflows in five of the following seven weeks since the liquidation event, totalling over $5 billion and $2 billion, respectively.
By the week ending November 21, the net asset value (NAV) held by BTC ETF issuers was down from about $164.5 billion to roughly $110.1 billion. The NAV of ETH ETFs fell almost 50%, from about $30.6 billion to about $16.9 billion. Some of that damage came from the price declines of BTC and ETH. The rest came from coins pulled entirely out of wrappers. Together, they erased around a third of the combined BTC and ETH ETF NAV in less than two months.
A dip in flows tells us more than just investor sentiment. It also has an immediate impact on the money ETF issuers/sponsors make via fees.
Bitcoin and Ethereum spot ETFs are revenue machines for issuers such as BlackRock, Fidelity, Grayscale, and Bitwise. Each fund charges a fee on the assets it holds, typically stated as an annual percentage but accruing on a daily net asset value basis.
Every day, the trust that holds BTC or ETH shares sells a part of its holdings to pay the fee and its other expenses. For the issuer, that translates into an annual revenue run rate that equals Assets Under Management (AUM) multiplied by the fee rate. For holders, it means a gradual dilution of coins over time.
ETF issuers charge fees ranging from 0.15% to 2.50%.
Redemptions or outflows, by themselves, do not directly make or lose money for the issuer. However, outflows result in fewer assets held by the issuer at the end of the day, on which they charge a fee.
On October 3, BTC and ETH ETF issuers collectively held $195 billion in assets. At the fee levels above, that corresponds to a very healthy fee pool. By November 21, the same products had about $127 billion of assets left.
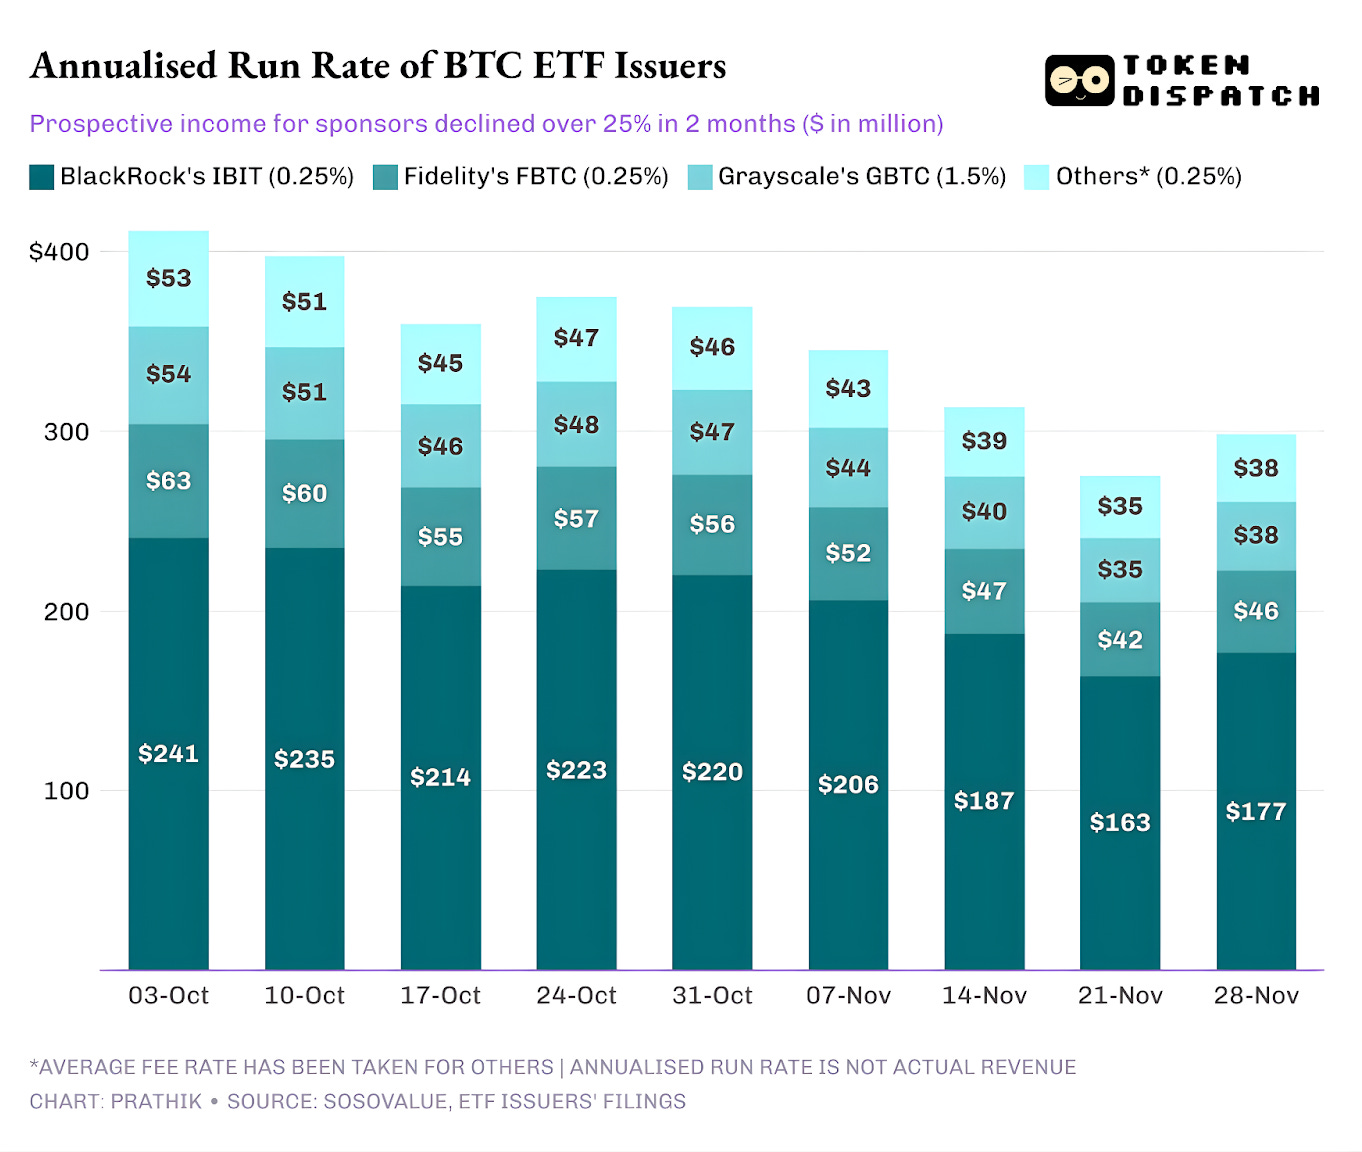
If annualised fee revenue is calculated based on AUMs at the end of the week, the prospective income from BTC ETFs declined by more than 25% over the last two months.
ETH ETF issuers saw a greater impact, with annualised revenue declining by 35% over the last nine weeks.
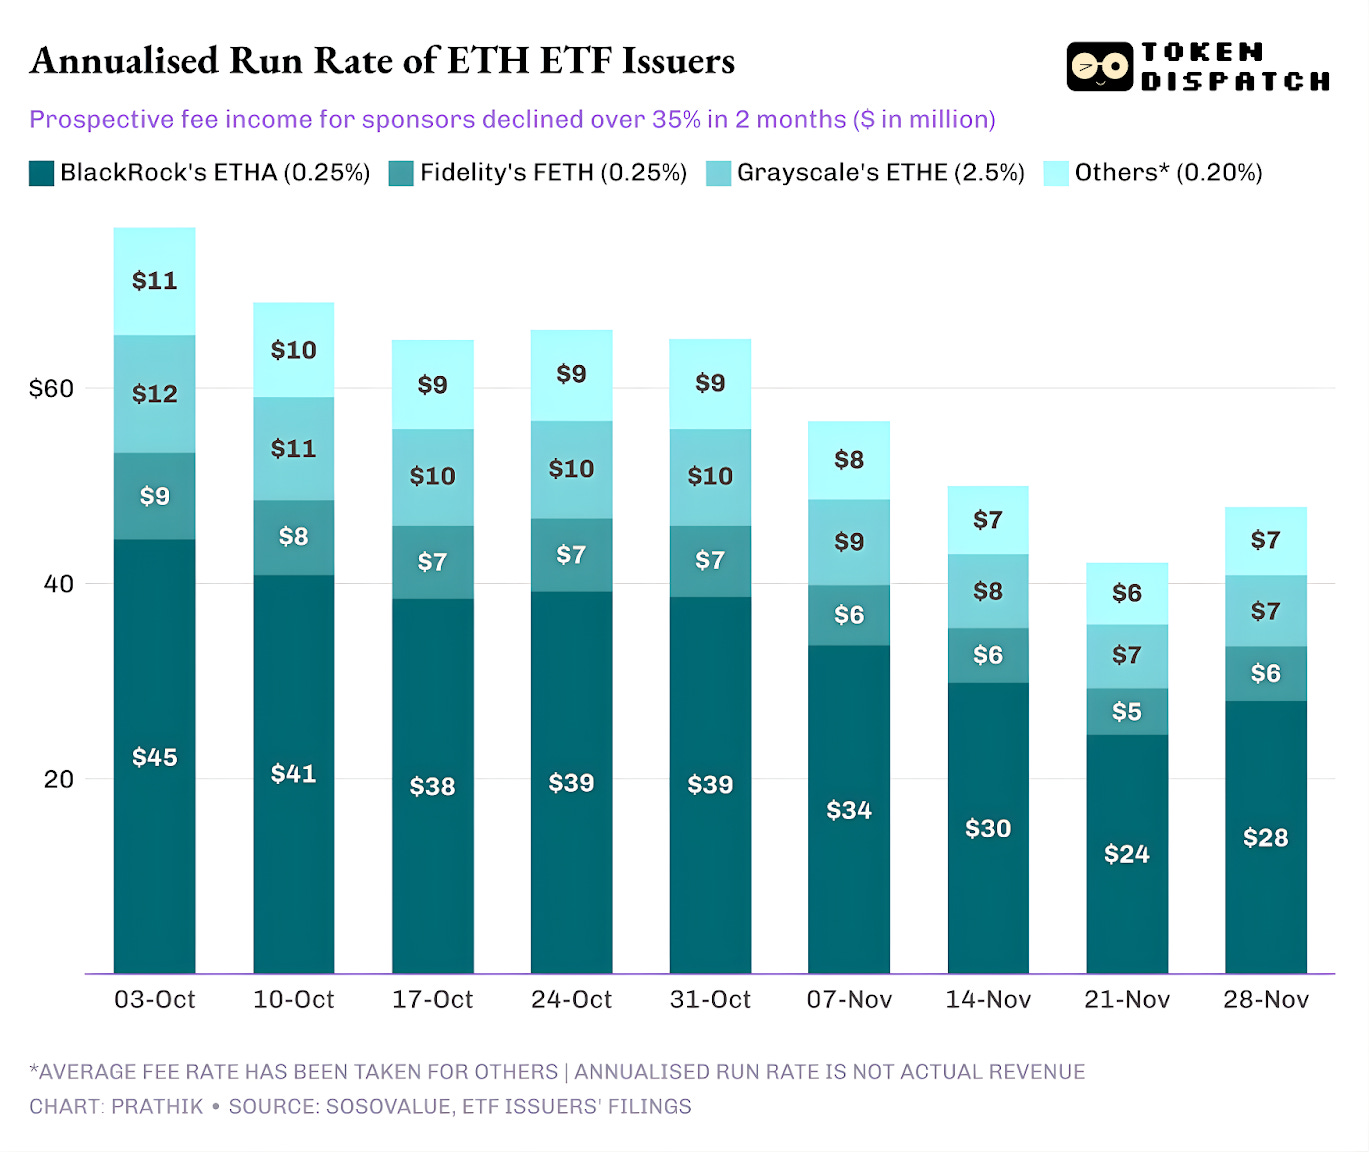
The Bigger the Issuer, the Harder they Fall
When you zoom out to the issuer level, the flows tell three slightly different stories for each ETF issuer.
For BlackRock, the picture is one of scale and cyclicality. IBIT and ETHA have become the default instruments for mainstream BTC and ETH exposure for investors who choose the ETF route. That gives the world’s largest asset manager an enormous base to charge its 25 basis points on, especially in times like early October when the AUM was at a record high. But that also meant that when large holders wanted to cut risk in November, IBIT and ETHA were the obvious tickers to sell.
It’s evident in how BlackRock’s annualised fee revenue from BTC and ETH ETFs fell 28% and 38%, more than the average 25% and 35% slide across issuers.
Fidelity’s experience aligns with BlackRock’s, but just at a smaller scale. FBTC and FETH followed the same inflow–outflow rhythm, with October’s enthusiasm giving way to November’s red bars.
Grayscale’s story is more about legacy. At one point, GBTC and ETHE were the only scalable ways for many US investors to own BTC and ETH in a brokerage account. That monopoly is gone with BlackRock and Fidelity leading the tables. What’s made it worse for Grayscale is its high fee structure in its initial wrappers. That led to a prolonged outflow trend over the past two years.
The October–November period also reflects this behaviour among investors. They have rotated capital to cheaper wrappers in good times and cut risk across the board in bad ones.
Grayscale’s initial crypto wrappers charged six to ten times the fee of a low-cost ETF. Although that helps inflate its revenue line, the expense ratio drives away investors and squeezes the AUM base on which it earns its fees. Every dollar that stayed often did so because of frictions such as taxes, mandates, and operational hassles, rather than active investor preference. Every dollar that left was a fresh reminder that, given a clean choice, more holders are voting against the high-fee wrapper.
All these ETF charts tell us a few things about the current phase of crypto’s institutionalisation.
The spot ETFs around October and November indicate that the business of managing crypto ETFs is cyclical, just like the markets of the underlying assets. When prices are high and headlines are friendly, more flows translate into higher fee revenue. It all rushes back out when macro conditions shift.
The big sponsors have built efficient toll roads on top of BTC and ETH, but October and November showed that those roads are not immune to the market cycles. For issuers, the game is about holding on to assets through the next shock, so the fee meter doesn’t waver by 25–35% every time macro winds shift.
While issuers can’t keep investors from redeeming during a sell-off, a yield-generating product can cushion some of the downside.
A covered-call ETF can provide investors with a premium that helps offset some of the price decline of the underlying asset. A staking-style wrapper can also be an option. Such products, though, will have to clear the test of regulatory scrutiny before they can go live.
That’s it for this week’s quantitative analysis. I’ll see you next week.
Until then, stay sharp,
Prathik

Token Dispatch is a daily crypto newsletter handpicked and crafted with love by human bots. If you want to reach out to 200,000+ subscriber community of the Token Dispatch, you can explore the partnership opportunities with us 🙌
📩 Fill out this form to submit your details and book a meeting with us directly.
Disclaimer: This newsletter contains analysis and opinions of the author. Content is for informational purposes only, not financial advice. Trading crypto involves substantial risk - your capital is at risk. Do your own research.
November wasn’t a crash—it was a reset. ETF flows flipping red show institutions de-risking, not disappearing, again this is Just reiterating reintegrate my understanding from this piece you put together.
When ETFs bleed, it’s usually macro—not crypto—doing the damage. The real signal is that AUM still grew despite the outflows.